Site menu:

cNORM - Generating Norm Tables
In addition to the pure modeling functions, cNORM also contains functions for generating norm tables, retrieving the normal score for a specific raw score and vice versa or for the visualisation of norm curves. These functions are described below.
getNormCurve
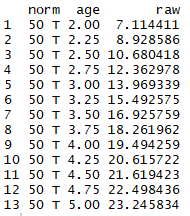
The first function 'getNormCurve' returns the fitted raw scores for a certain normal score (e.g., T = 50) across different age groups. The parameter 'step' specifies the distance between two age groups. If no further specifications are made, the output is limited to actually occurring raw values and age groups.
getNormCurve(50, model, minAge = 2, maxAge = 5, step = 0.25, minRaw = 0, maxRaw = 28)
Percentile Curves
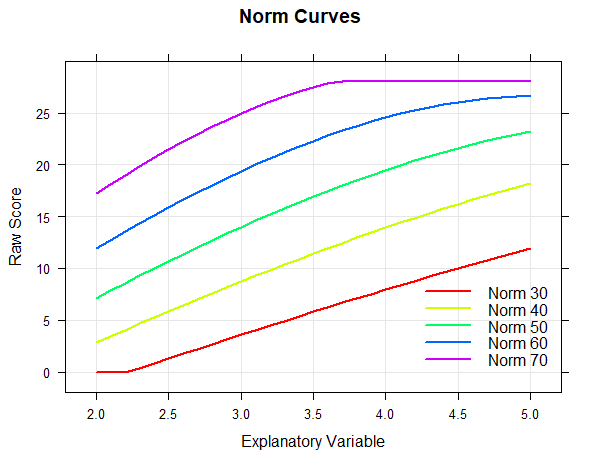
The 'plot("curves")' function plots the fitted raw scores for pre-specified normal scores (e.g., T = 30, 40, 50, 60, 70) across age.
plot(model, "curves", normList = c(30, 40, 50, 60, 70), minAge = 2, maxAge = 5, step = 0.1, minRaw = 0, maxRaw = 28)
predictNorm
The 'predictNorm' function returns the normal score for a specific raw score (e.g., raw = 15) and a specific age (e.g., a = 4.7). The normal scores has to be limited to a minimum and maximum value in order to take into account the limits of model validity.
predictNorm(15, 4.7, model, minNorm = 25, maxNorm = 75)
predictRaw
The 'predictRaw' function returns the predicted raw score for a specific normal score (e.g., T = 55) and a specific age (e.g., a = 4.5).
predictRaw(55, 4.5, model$coefficients, minRaw = 0, maxRaw = 28)
normTable
The 'normTable' function returns the corresponding raw scores for a specific age (e.g., a = 3) and a pre-specified series of normal scores. The parameter 'step' specifies the distance between two normal scores.
normTable(3, model, minRaw = 0, maxRaw = 28, minNorm=30.5, maxNorm=69.5, step = 1)
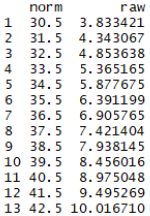
Norm tables, in which the raw score or the range of raw scores is given for a certain normal score, are usually needed if one has several test scales, all of which are to be converted into the same type of normal scale. Please note that as a test designer you cannot use this function directly to generate norm tables. Instead you have to convert the table to a suitable form first. Remember that raw scores are usually integers. Therefore, the normal score series should not start at an integer value, but e.g. at 30.5. If a step size of 1 is selected, normal score intervals with integers as interval centers are generated. In the example shown, the T-score intervall [30.5; 31.5] contains only one single integer raw score, namely 4, which would therefore be assigned to the T-score 31. A whole range of raw scores (or no raw score at all) can thus be assigned to a particular integer normal score.
rawTable
The function 'rawTable' is similar to 'normTable', but reverses the assignment: The normal scores are assigned to a pre-specified series of raw scores at a certain age. This requires an inversion of the regression function, which is determined numerically.
rawTable(3.5, model, minRaw = 0, maxRaw = 28, minNorm = 25, maxNorm = 75, step = 1)
# generate several raw tables
table <- rawTable(c(2.5, 3.5, 4.5), m, minRaw = 0, maxRaw = 28)
You need these kind of tables if you want to determine the exact percentile or the exact normal score for all occurring raw scores.
Use of CNORM/Licensing
If you want to use cNORM for your own work, please note the licenses terms and conditions.
 |
Model Validation |
Examples |
 |