Site menu:

cNORM - Troubleshooting and Rarely Asked Questions (RAQ)
Content
- Intersecting Percentile Lines
- Required Sample Size
- Weak Relationship between Explanatory Variable and Raw Scores
- Wavy Percentile Lines
- Modeling with a Continuous Age Variable Fails
- Is it Possible to Weight Cases in the Normative Sample?
cNORM works 'out of the box' in many application scenarios, especially with sufficiently large datasets and when the explanatory variable accounts for a substantial amount of variance of the raw scores (for example, when there's a clear age trend). However, there are cases that are more challenging. We strongly recommend checking the generated solutions for plausibility and manually adjusting parameters if necessary. Similar to factor analyses, model selection is a multi-stage process typically requiring the calculation and comparison of different models based on various quality criteria. For cNORM, there are three main quality criteria: R2, model simplicity, and model plausibility/consistency. The latter must be particularly considered at the model boundaries.
In summary:
- Power parameters of k = 5 for person location and t = 3 for age are sufficient for most applications. When working with discrete groups, the parameter 't' should always be chosen at least 1 lower than the number of groups. For example, with only two age groups, t should be set to 1, as higher-order relationships cannot be captured in this case.
- Models with a relatively small number of terms (e.g., 'terms = 4' to 'terms = 10') are typically most robust and generally yield the best results in cross-validations. Avoid models with many terms; you should rather accept a slightly lower R2 instead.
- After initial model calculation, inspect the information functions of the model ('plotSubset') and plot percentile diagramms ('plotPercentiles' and 'plotPercentileSeries') as a function of the number of predictors. Finally, recalculate the model using the parameters you previously determined as optimal, such as with a specific number of terms.
- Whether using discrete age groups or a 'sliding window': The interval widths should always be chosen to ensure at least 100 individuals per group or per sliding window. For a dataset with many finely graduated, but small age groups, it may be more advantageous to combine age groups into broader intervals.
1. Intersecting Percentile Lines
Occasionally, inconsistent models may occur, particularly in extreme performance ranges, or in tests with strong floor or ceiling effects. These inconsistencies manifest, for example, in intersecting percentile lines ('plotPercentiles()') or when the modeling process generates corresponding warnings ('checkConsistency()'). Since version cNORM 3.2, automatic checks have been built into the 'cnorm()' function to help ensure that models with inconsistencies are not returned. However, these are only rough checks, and in individual cases, intersecting percentile lines may still occur.
Possible solutions:
- Vary the number of terms in the model (parameter 'terms' in the 'cnorm()' function).
- Use cross-validation ('cnorm.cv()') and plot information criteria as a function of the number of predictors ('plotSubset()') to determine a reasonable number of predictors. Less is often more in this case.
- Use the 'plotPercentileSeries()' function to generate a series of percentile diagrams. Specify the maximum number of terms using the 'end' parameter. Visually check if a different number of terms leads to a more consistent solution.
- If necessary, reduce the power parameter 't'. Too high a t value can lead to wavy percentile lines and consequently to inconsistencies.
- Keep in mind that every model has inherent limitations and only produces consistent results within a finite range. Therefore, carefully consider which range of norm scores you actually need to cover. Evaluate whether your test is truly suitable for covering this range, and identify where ceiling or floor effects might occur. Remember that norm scores should only be reported for areas in which the model produces consistent results. In some cases, you may need to simply truncate inconsistent areas.
# Plots a percentile diagram of the current model
plotPercentiles(model, data)
# Plots a series of percentile diagrams for up to 10 predictors
plotPercentileSeries(model, data, end=10)
2. Required Sample Size
Our simulations indicate that relatively reliable models can be calculated with as few as 50 cases per age group (see figure). Nevertheless, we recommend maintaining a minimum sample size of 100 per age group (or per width of the window when using the 'sliding window' approach). This recommendation is primarily based on the fact that the representativeness of the normative sample is a crucial influencing factor. Achieving representativeness is often difficult with group sizes of less than 100 individuals. When the sample size is too small, not only does it reduce the power of the applied statistical procedures, but it also becomes challenging to stratify the sample across all relevant variables.
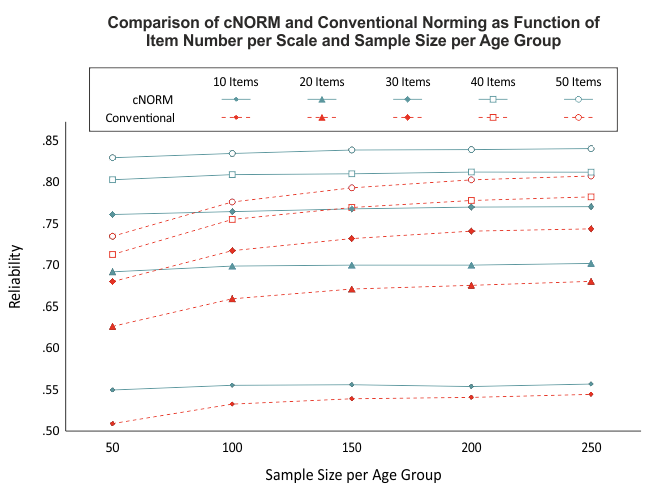
While cNORM can partially compensate for minor violations of representativeness or small sample sizes in individual age groups (since the models are calculated based on the entire dataset), establishing a high-quality normative sample should remain a priority when generating test norms.
Possible solutions:
- If you have few cases in individual age groups, it's preferable to combine the data into larger age groups. Note that the midpoints of the age intervals don't necessarily need to be equidistant.
3. Weak Relationship between Explanatory Variable and Raw Scores
Since version 1.1.8, cNORM automatically uses polynomial regression to assess the relationsship between the raw scores and the explanatory variable. If there is only a weak relationship, cNORM generates a warning message. In such cases, it's worth considering whether including the explanatory variable in the calculation of norms is truly meaningful, or whether a single norm table might suffice. When the explanatory variable accounts for only a small proportion of variance, the models may sometimes be unstable, and the target of R2 ≥ .99 for the overall model might not be achieved.
Possible solutions:
- Set t = 1. This assumes only a linear effect for the explanatory variable, which is easier to model.
- If this doesn't help, you may need to consider excluding the explanatory variable altogether. To do this, specify neither a grouping nor an age variable in the 'cnorm()' function. The data will then be directly converted to norm scores. You can still use the designated functions (e.g., 'normTable') to create norm tables.
4. Wavy Percentile Lines
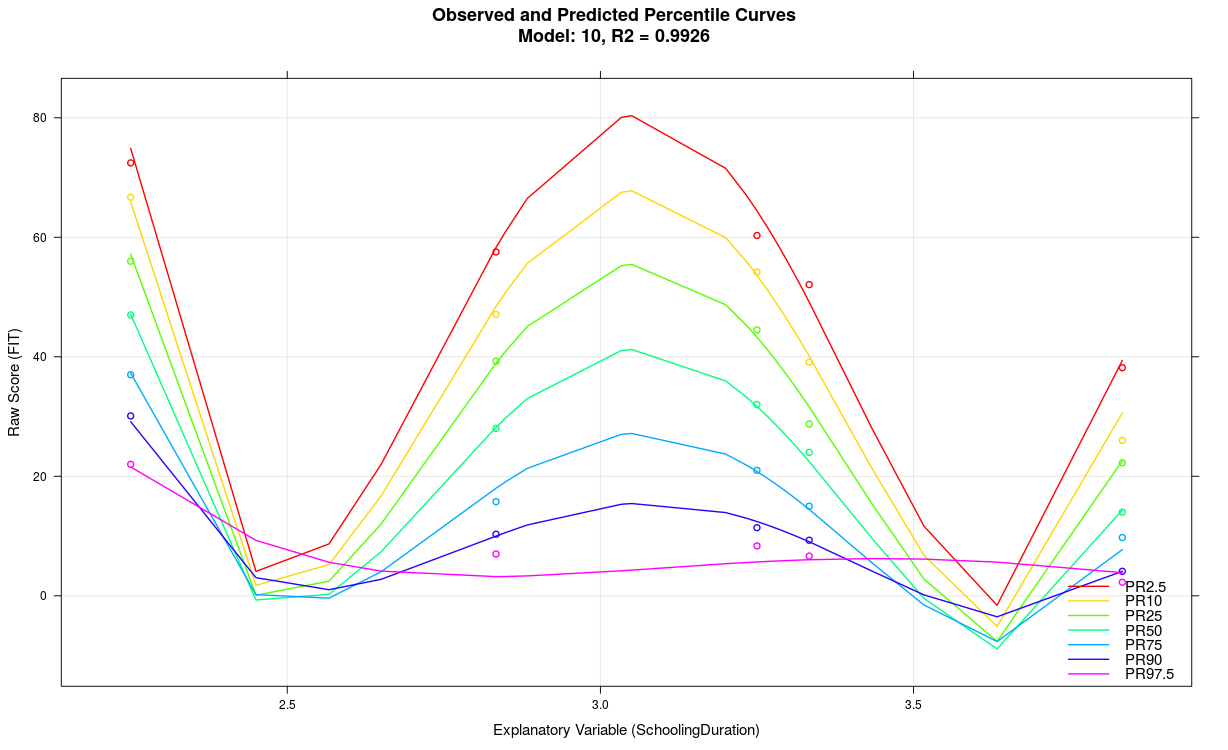
The model likely exhibits overfitting, for example, because the parameter 't' was set too high, the explanatory variable accounts for limited variance, too many predictors were used, or the scale generally lacks reliability, etc. Wavy percentile lines can also result from small sample sizes in individual groups, as in the above example with n = 50. In some cases, wavy percentile lines might also indicate that the cNORM package is reaching its performance limits. Usually, it's advisable to use a more simply structured model with fewer terms.
Possible solutions:
- Reduce the parameter 't'
- Reduce the number of terms
- Examine your data: Are the subsample sizes sufficient? Is there a clear effect of the explanatory variable on the raw scores?
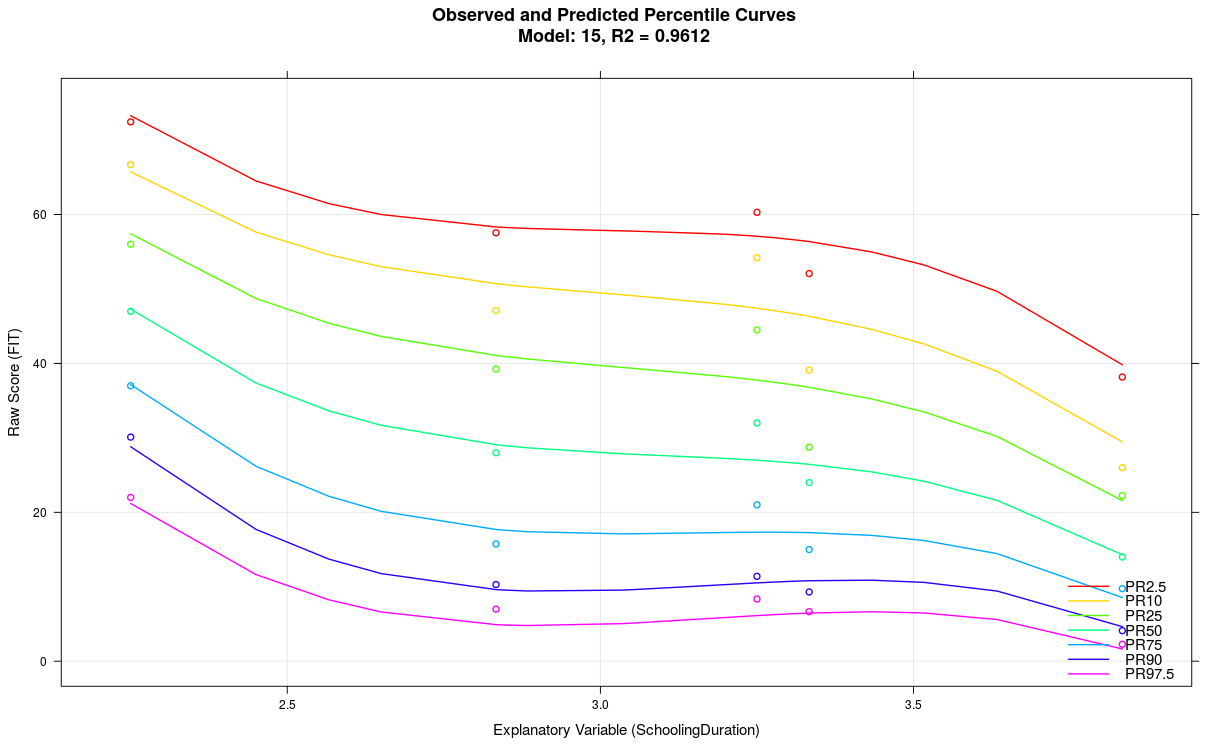
In the above example, the parameter 't' was set to t = 5 with a group size of only 50. When reducing the parameter to t = 3 and simultaneously decreasing the number of terms from 21 to just 7, the following model results:
5. Modeling with a Continuous Age Variable Fails
You could use discrete age groups instead. When specifying a grouping variable in the 'cnorm()' function, ranking is performed using this grouping variable. However, for the modeling to work properly, the grouping variable must correspond to the age variable. This means: The values of the grouping variable should reflect the mean age of the respective age groups.
Possible solutions:
- Calculate the mean age of the age groups. Verify whether this mean age corresponds to the assigned grouping variable for each person in the data.
- The 'getGroups()' function can automatically split continuous age variables into separate groups. This requires specifying the variable to be split. Additionally, you can specify the number of groups to be created.
# Creates a grouping variable with 10 equal-sized groups
# from a continuous age variableADHD$group <- getGroups(ADHD$age, n = 10)
6. Is it Possible to Weight Cases in the Normative Sample?
Cases can be weighted using the 'weights' parameter. Additionally, cNORM includes the 'computeWeights()' function for generating weights using raking. This can help reduce the effect of unbalanced normative samples.
 |
Jamovi |
Overview |
 |