Site menu:

cNORM - Continuous Norming with cNORM in Jamovi
Jamovi is a very intuitive, free and open source statistical software. We have contributed the module "cNORMj" to the Jamovi software library, which offers you the essential cNORM functionality to generate norm scores for single groups or to apply regression-based continuous norming.
Norm Score Generation for Single Groups
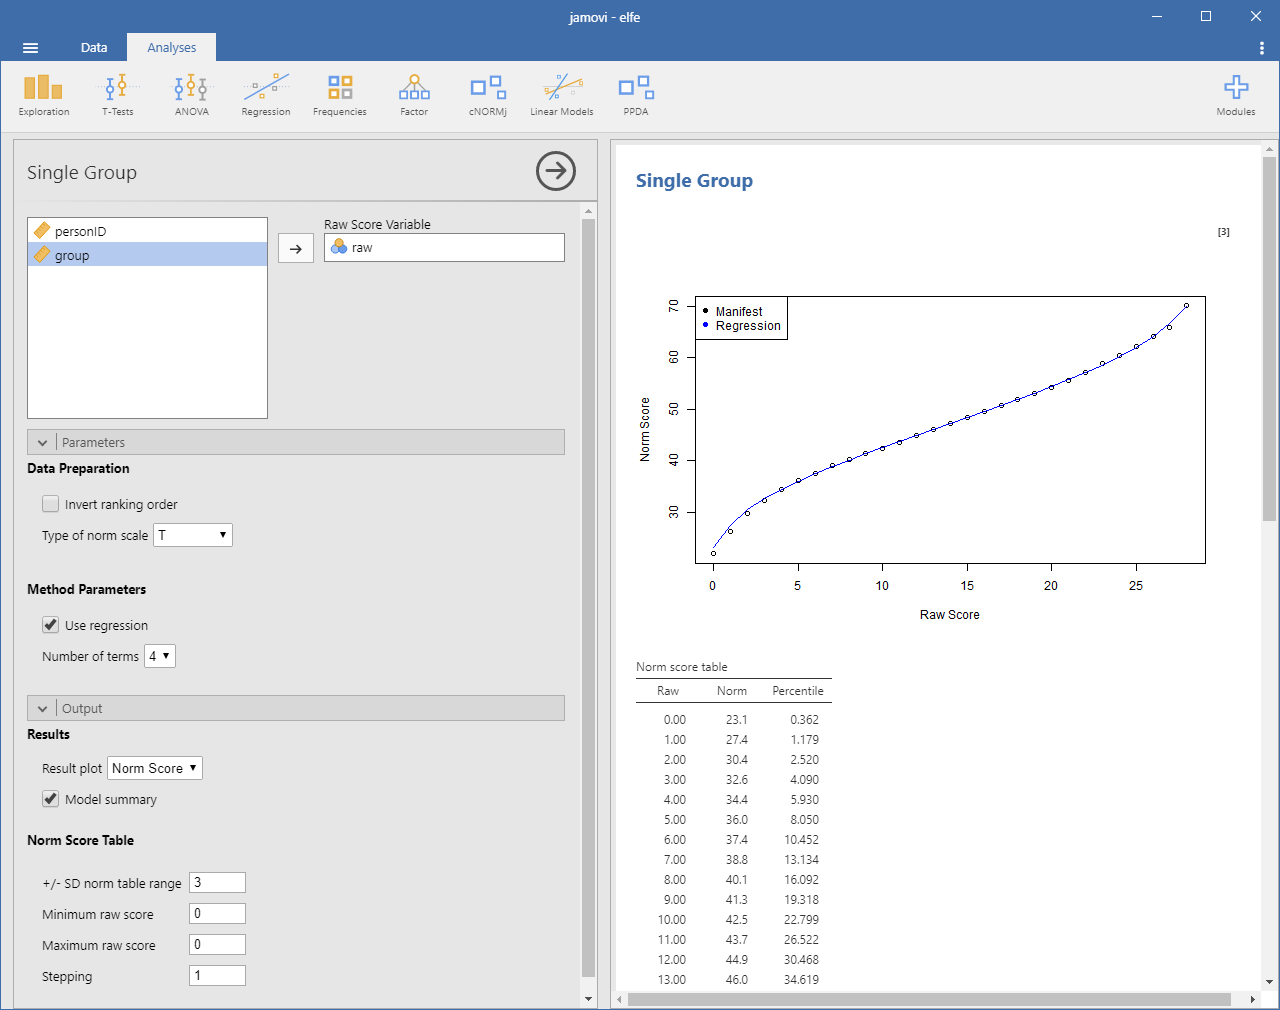
This module calculates norm scores for individual groups and compiles norm tables. To smooth the norm data and fill in gaps caused by missing raw scores, the functional relationship between raw scores and norm scores is modeled using polynomial regression up to the 5th power, utilizing the cNORM package (W. Lenhard, Lenhard & Gary, 2018).
Please specify the raw score variable to obtain the according norm table. Additional options:
- Data Preparation
- Invert ranking order: Enable this option to set the ranking order to 'descending'. In this case, low norm scores will be assigned to high raw scores and vice versa.
- Type of norm scale: You can select T-scores, IQ-scores, z-values, PISA scales (m = 500, sd = 100) and Wechsler (m = 10, sd = 3) scales.
- Use regression: Per default, the module uses regression to model the relationship between raw and norm scores. If this option is deactivated, it simply reports the manifest percentiles and norm scores on the basis of an inverse normal transformation of the percentiles (bindings are addressed via RankIt).
- Output
- Result plot: The plot is either set to norm scores or percentiles (cumulative function).
- Model summary: Provides a report on the regression model.
- Norm table range: Restricts the range of norm scores to the specified multiple of a standard deviation. It's generally not advisable to exceed a norm score range of more than -3 SD to +3 SD unless you have a very large dataset.
- Minimum raw score and Maximum raw score: Specifies the boundaries of the generated norm score table. Please note that this option is only taken into account, if the maximum score is higher than the minimum score. Otherwise, the minimum and maximum raw scores occurring in the data are used.
- Stepping: Sets the granularity of the norm score table.
Continuous Norming (Distribution free)
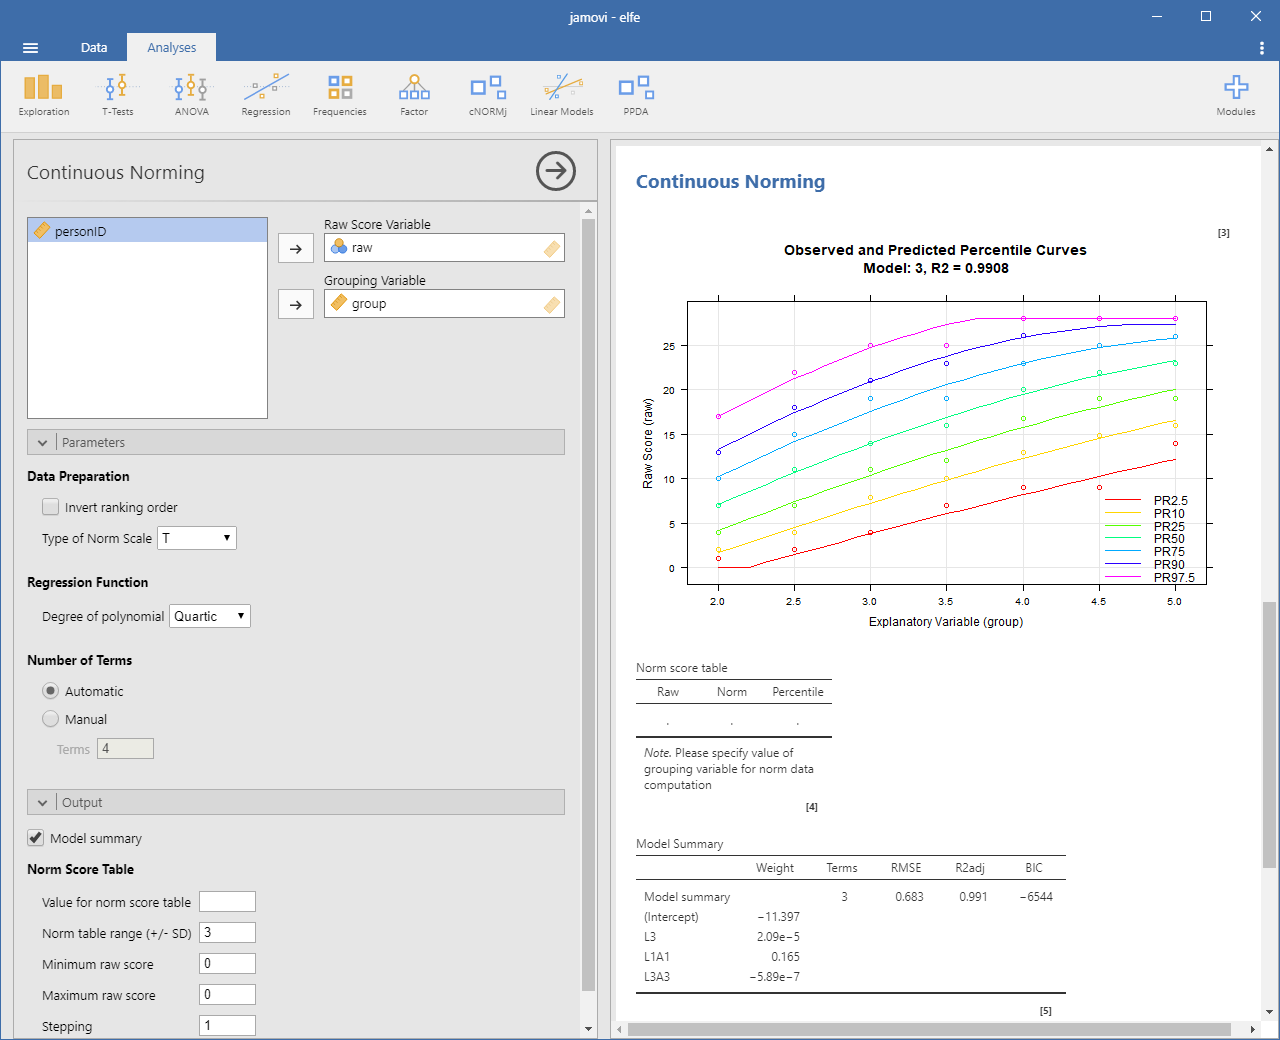
The module estimates continuous norm scores by modeling the functional relationship between raw scores (raw), norm scores (L) and the grouping variable (A; e. g. age, schooling duration ...) using the cNORM package (W. Lenhard, Lenhard & Gary, 2018). The modeling procedure minimizes the error variance contained in the norm scores. It requires smaller samples sizes compared to conventional norming, closes gaps within and between the norm tables and smoothes sampling errors.
Select a model with a low number of terms while preserving a high R2 of the model. Avoid intersecting percentile curves. The module gives you the following options:
- Data Preparation
- Invert ranking order: Please activate this option to set the ranking order to 'descending'. In this case, low norm scores will be assigned to high raw scores and vice versa.
- Type of norm scale: You can select T-scores, IQ-scores, z-values, PISA scales (m = 500, sd = 100) and Wechsler (m = 10, sd = 3) scales.
- Degree of polynomial: cNORM employs polynomial regression using Taylor polynomials to determine statistical models for the relationship between grouping variables, norm scores, and raw scores. The degree of the polynomial indicates which higher-order relationships are being modeled. As a rule, it is advisable to select 5 for 'location' and 3 for 'age'. If there are not many age groups available, it may also make sense to select a grade lower than 3 for age.
- Number of terms: cNORM tries to find an optimal solution but it might be necessary to fine tune the model. Please vary the number of terms and use visual inspection of the percentile plot to identify the best solution.
- Output
- Model summary: Provides a report on the regression model. 'A' in the function refers to the grouping variable (e.g., age) and 'L' to the person location (i.e., the norm score). For example, raw ~ L2 + L2A4 indicates that the raw score is predicted by the squared norm score and an interaction term of norm score (power 2) and grouping variable (power 4).
- Value for norm score table: Since the models are continuous, you explicitly need to specify the age for which you would like to generate a norm table. If you want to create norm scores for children from 10 years 0 months to 10 years 3 months, please enter the according midpoint of the interval, i.e. 10.125.
- Norm table range: Restricts the range of norm scores to the specified multiple of a standard deviation. It's generally not advisable to exceed a norm score range of more than -3 SD to +3 SD unless you have a very large dataset.
- Minimum raw score and Maximum raw score: Specifies the boundaries of the generated norm score table. Please note that this option is only taken into account, if the maximum score is higher than the minimum score. Otherwise, the minimum and maximum raw scores occurring in the data are used.
- Stepping: Sets the granularity of the norm score table.
Continuous Norming (Beta Binomial)

This module estimates continuous norm scores using the beta binomial distribution, which is particularly suitable for discrete item count data where raw scores are integers ranging from 0 to the maximum number of items. It does not require grouping data into norm groups, but relies on distribution assumptions. In psychometric tests, this is especially true for IRT logistic models (e. g. Rasch). Please note that the computation takes some seconds.
The beta-binomial model relates raw scores, norm scores, and an explanatory variable (e.g., age) by modeling the parameters α and β of a beta-binomial distribution as polynomial functions of the explanatory variable.
Please proceed as follows:
- Select your raw score variable (integer values from 0 to max)
- Place the explanatory variable (e.g., age) in the appropriate slot
- Specify the number of items in your test (or leave empty to use the maximum raw score)
- Adjust model parameters for optimal results:
- Alpha parameter degree: Controls the complexity of the alpha parameter curve (usually 3 is sufficient)
- Beta parameter degree: Controls the complexity of the beta parameter curve (usually 3 is sufficient)
- Norm Table Value: Specify the value of the explanatory variable to generate a norm table
Further information on the procedure is available via Parametric Modelling.
Sample Datasets

The cNORMj module includes the dataset from the cNORM package. You can use these to get accustomed to the analyses. To load the dataset, please click on the burger menu at the top left and select 'Open'. You will find the datasets in 'Data Library' in the folder 'cNORMj'.
Installation

The 'cNORMj' module is available via the Jamovi library for all platforms. Please click on the 'Modules' option on the top right. You will find a library for the installation and management of the modules. You can as well download the module for Win64 and install it manually via 'Sideload'.
| Version | Name | Date |
| Binary Package (Windows, 64 Bit) | cNORMj Module (v. 3.0.1) | 07/03/2026 |
 |
Webinterface |
Rarely Asked Questions |
 |